
Use living graphs then teaching political alignment makes it easier for our students to visualise where the political parties fall on political scales in a complex political system like the Danish system or in other European systems.
My students need to know about the political scales for new politics (post-materialistic) and old politics (materialistic) as well as ideology.
One of the exercise I have found really helpful is this one using post-its to create living graphs.
Teaching political alignment with living graphs
Instead of the teacher explaining the system and political scales of political alignment on the board, the student build the scales them self. They get to talk about their placements and get textile input to help them remember it.
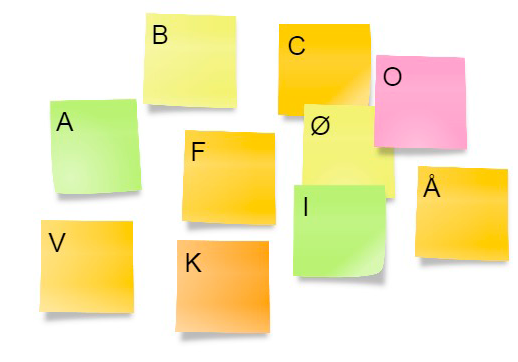
Exercise: Political alignment with living graphs
Materials needed: Sticky notes
Time needed: About 8 minutes for the first round
- Divide the class into pairs and give each pair a stack of sticky-notes
- Get them to write all the political party names (or party letters) on the notes
- Explain how to sort the parties and get them to put the sticky-notes on a scale – for instance with the most socialist party on the left and the liberal on the right on their table. It can be a good idea to write on the board what left represent and what right represent.
- Give the students 5 minutes to sort the parties on the scale using their sticky notes.
(If we have done a lot of research before hand or have read about the scales at home, then they are not allowed to look up the placement in the book).* - Let them compare with the group next to them to check if they argree.
- (Optional): End the exercise by doing it on the board and talk about why we are placing the parties on the scale in that order.
- Do the exercise again with a different sorting criteria. Ex. post-maternalistic politics.
* We had read about and talked about the political parties beforehand so this was both a review of that material and teached the new concept of the scale.

Taking it further
After they sorted the political parties on old-politics left/right and by new-politics left/right scala, they made a coordinate system out of their sticky-notes. We talked about the fact that some parties are quite economically liberal while being quite post-materialist leftist. We used that to talk about which political issues that was most important today and to talk about why there are no old-left/new-right parties and about what such a party would stand for.
I have tried this with a number of topics and it works really well as a visualisation of political opinions on a number of different subjects. For instance the different political parties opinion on EU or climate change.
For more on the subject of living graphs read: activehistory.co.uk.
Originally posted: 14/6 2015
Updated: 21/6 2023
About me as a teacher
I teach social studies and history at a high school level in Denmark. I teach mostly samfundsfag C & B and History as part of KS (cultural studies). I have been teaching for more than ten years.
I have a masters in history from Aarhus University and I minored in social studies. Read more about me and see my teaching resume.
I choose to write my teaching blog posts in English because I want to give back to the teaching community that inspires me.

Leave a Reply